

Original workRobustness 56/100
EURGBP · 4-hour
+210.1% net return over the 2016–2026 backtest, a profit factor of 1.50, 70.7% of trades won and a deepest drawdown of 25.0%.
EURGBP · 4-hour · 372 trades
The site as an AI agent reads it: plain facts, no layout. Point your assistant at any of these files.
Loading /llms.txt…
Takumis does the work that normally takes weeks. It helps you think the idea through, then pulls the market data, analyses it, writes the code, runs the backtest and keeps improving the strategy with you. It is in private beta: register to request access.
Is there an edge around the London open on GBPUSD?
Does EURUSD move differently on days with a US inflation release?
Find me a mean-reversion idea for a quiet currency pair and test it…
Which of the major pairs trend best on the daily chart?
The workspace
A mean-reversion idea on AUDCAD, described in plain language, revised in the chat and backtested on ten years of data. The conversation is on the left and the results are on the right.
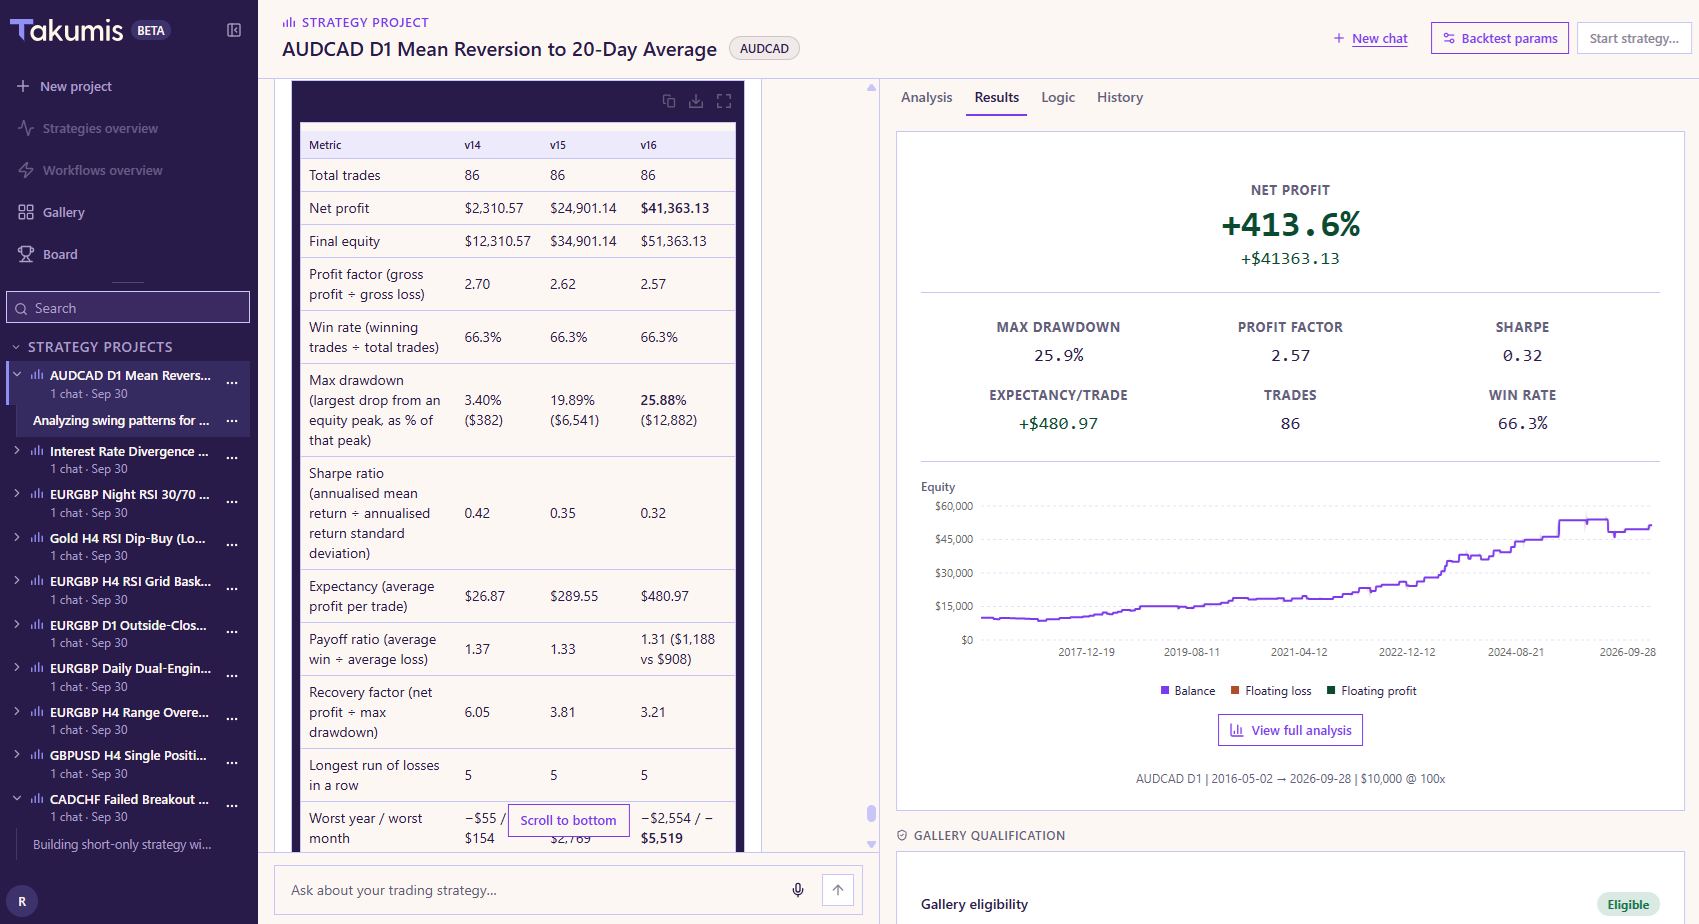
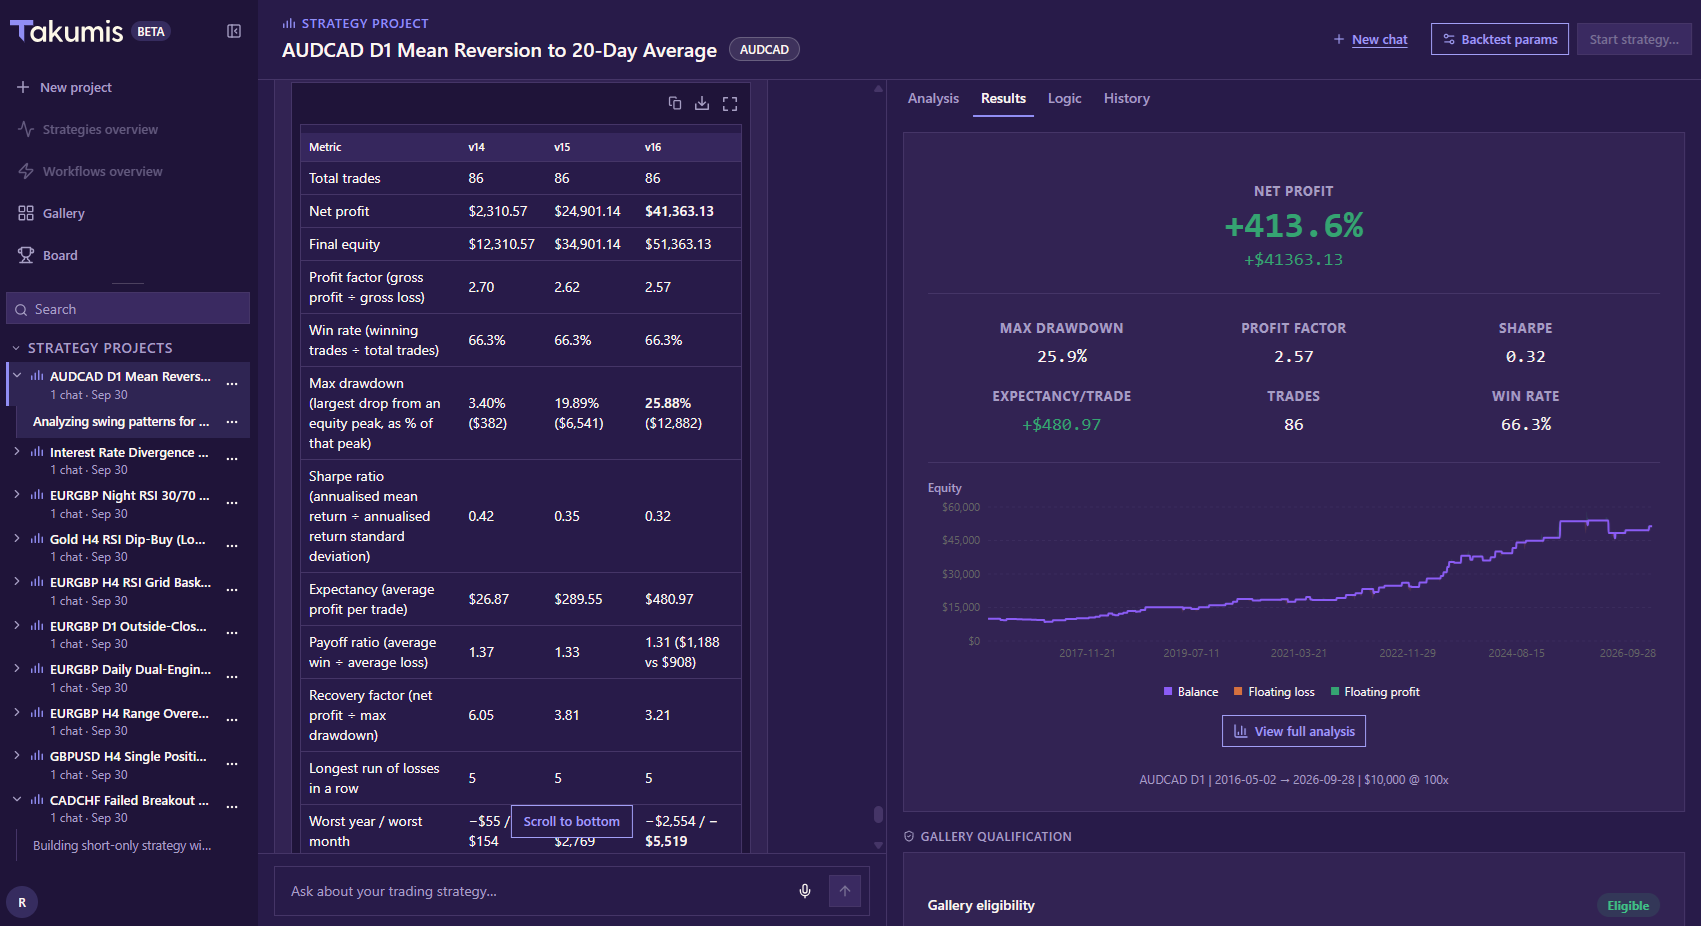
The strategy was described in plain language and revised in the chat, one version at a time.
Ask how two versions compare and Takumis lays them out next to each other, so you can see what a change bought you and what it cost.
The Results tab shows the full backtest and whether the strategy passes the qualification test to be published, with its robustness score.
Take nothing on trust
You should not have to take our word for any of this. Here is the full analysis of the same backtest, and how to check each claim.
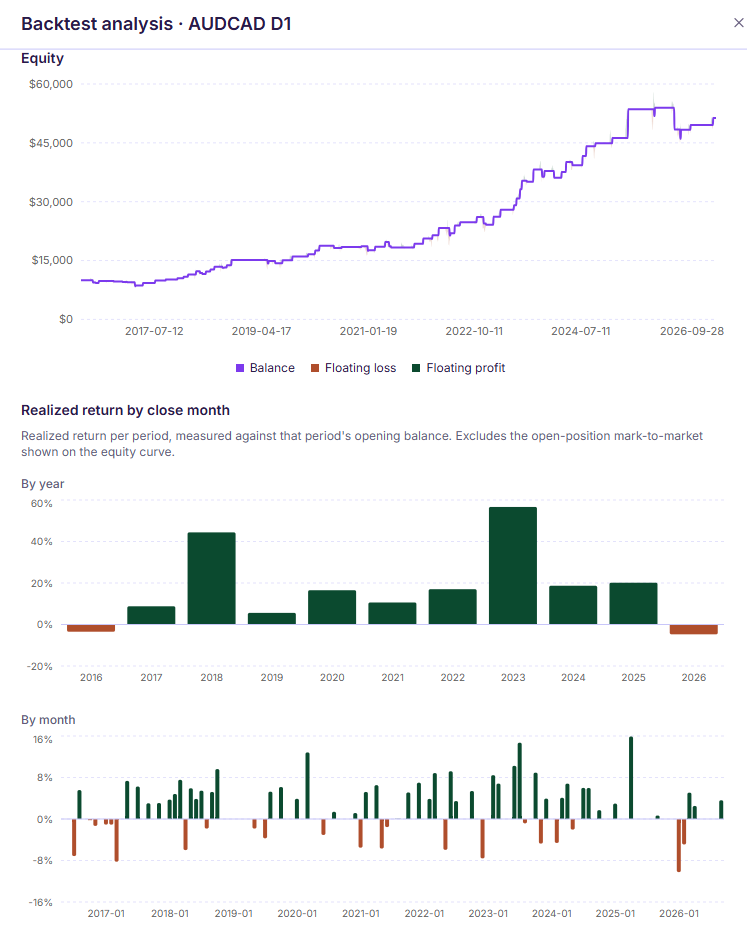
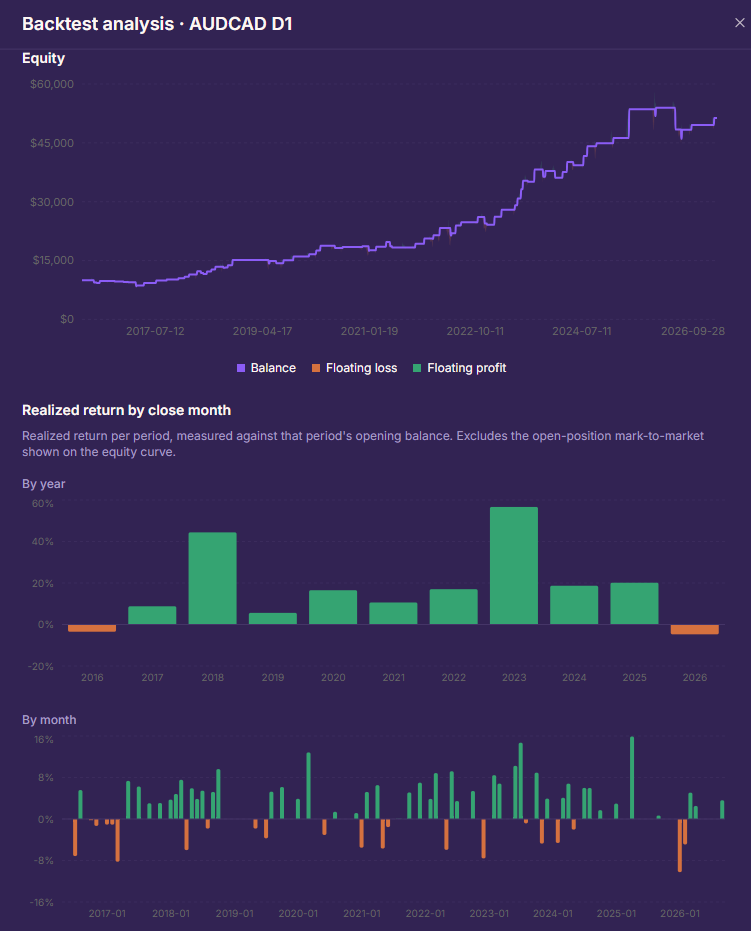
Run the same backtest twice and you get the same trades, down to the timestamps. Run it again in six months and nothing has changed, because no AI is involved once the strategy is built.
The full analysis lists each trade with its entry and close time, direction, pips and result, next to the equity curve and the returns by year and by month.
You set the spread before every run, and commission is charged on every trade. Set the spread to zero and watch the curve improve: that difference is part of the honest cost of trading. Swap is charged on every position held overnight.
Fork any strategy from the gallery and re-run its backtest on the same period to see the numbers for yourself.
The line we don't cross
Once the code exists, the model is gone. No inference while a position is open, no sampling, no drift between the version you approved and the version that runs.
Every condition that can open or close a position is written out in plain language, in one place.
Run the same backtest in six months, get the same numbers.
When your strategy runs, it follows its written rules and nothing else. No AI is making decisions on the fly, so it can't surprise you with a trade you didn't design.
Every change becomes a new version, and Takumis can lay versions side by side so you see what each change did.
Where this goes
The strategy you build today is the one that will run later, with nothing rebuilt or re-translated in between.
Describe it, let Takumis build it, and keep revising it in the chat until the logic is what you meant.
On the partner broker's historical market data, with the spread you set and commission applied. Swap is charged on positions held overnight.
From a finished backtest to your own broker account: the same strategy, unchanged, under the broker's terms.
Live performance tracking so you know how your strategy is doing.
Strategies
Published strategies come with their backtest and their lineage, and you can re-run every one of them before you trust a single number in it.
+210.1% net return over the 2016–2026 backtest, a profit factor of 1.50, 70.7% of trades won and a deepest drawdown of 25.0%.
+399.4% net return over the 2016–2026 backtest, a profit factor of 1.37, 59.2% of trades won and a deepest drawdown of 23.7%.
+319.4% net return over the 2016–2026 backtest, a profit factor of 1.61, 61.3% of trades won and a deepest drawdown of 21.9%.
These are backtested results, not trading records. Every figure above is hypothetical, constructed with hindsight over a fixed historical window (2016–2026), and does not represent money made or lost. Net return is after all trading costs: spread, commission and swap. Robustness scores four structural properties of the backtest — how much of the profit rests on one trade, how many trades it rests on, how much of its deepest drawdown it won back and how quickly, and the profit factor.
Nothing in this gallery is a recommendation. Users publish their own strategies; the qualification test is a mechanical pass or fail, not an endorsement.
Start with a sentence, even a rough one. Takumis helps you think it through, then pulls the market data, writes the code, runs the backtest and keeps improving the strategy with you, in minutes instead of weeks of work. Register to request access.